Urban Phenology
Using phenocam-based greenness indices to model the influence of urban vegetation phenology on carbon sequestration in city ecosystems.
Highlights
- Developed a computer vision pipeline combining manual and automated phenocam labelling to extract high-resolution urban phenology signals.
- Linking phenology indices with flux tower data enables modeling of urban carbon dynamics, with future extensions to traffic cameras and integration with SIF data.
Abstract
Urban areas, covering less than 2.4% of Earth's land, generate over 80% of global CO₂ emissions. Carbon cycles in urban areas are shaped by both human activities and vegetation, whose seasonal changes are described by plant phenology. Field-based phenology monitoring is labor-intensive and limited in scope, while satellite remote sensing lacks the spatial resolution needed for complex urban settings. Phenocams, fixed-position cameras capturing regular images of vegetation, offer a high-resolution, near-continuous alternative for tracking canopy changes.
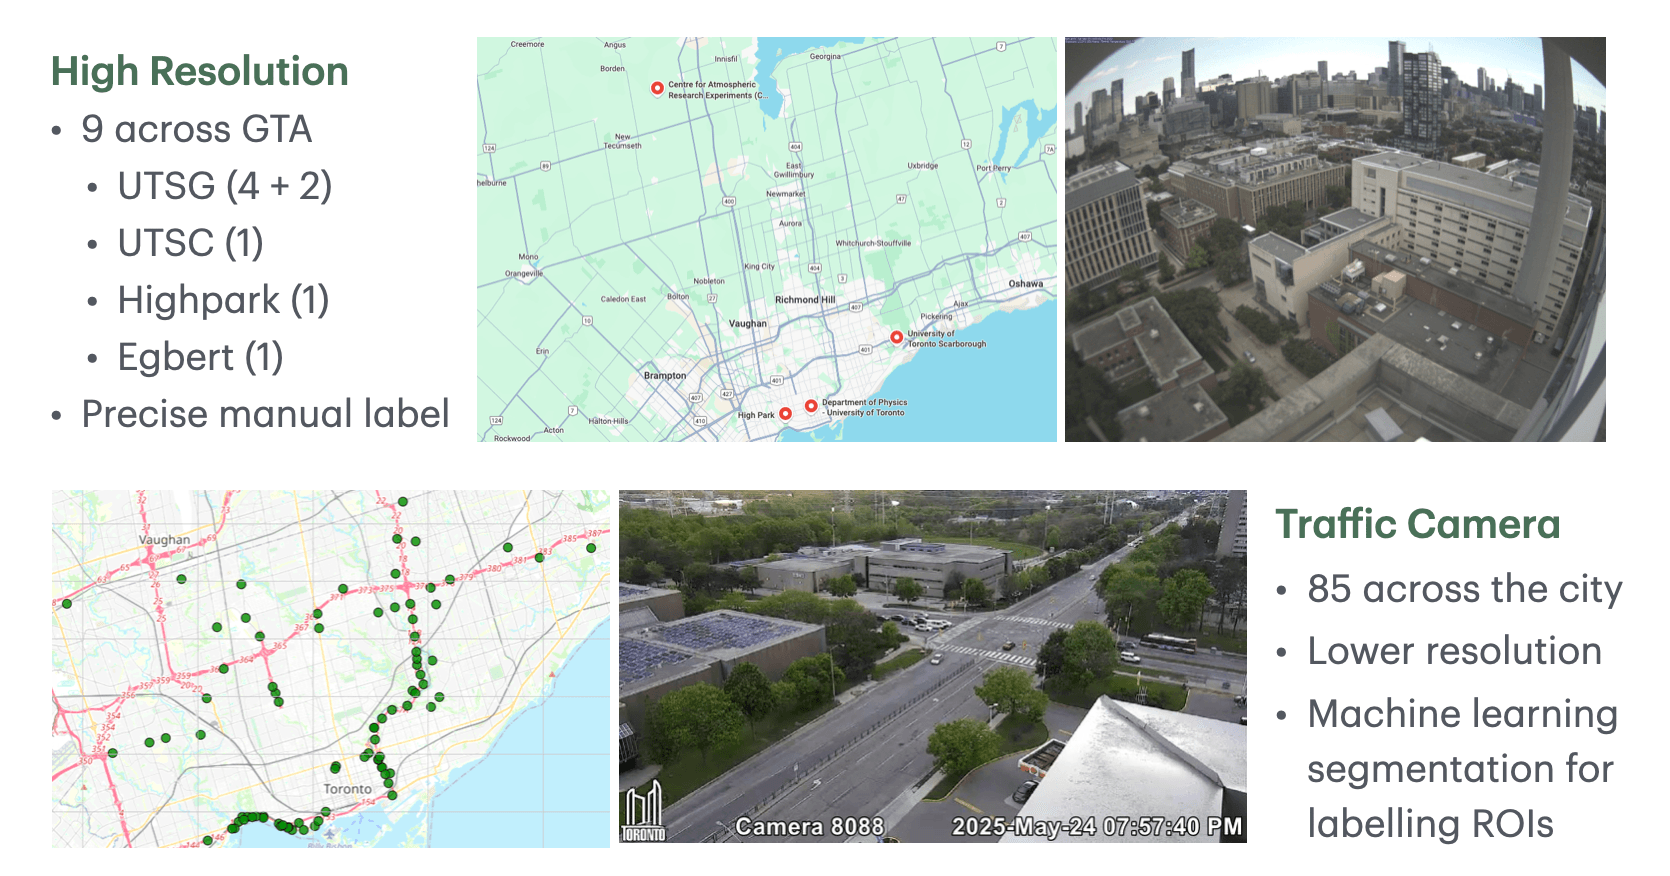
Since 2022, the Toronto Atmospheric Monitoring of Emissions (TAME) project has deployed nine phenocams across the University of Toronto and the Greater Toronto Area, complemented by City of Toronto traffic camera footage. Within this effort, our sub-project develops a computer vision pipeline that combines auto-labeling for traffic cameras and manual labeling for high-resolution phenocams.
The project will continue to refine the computer vision pipeline for extracting phenology indices, then analyze their relationship with urban carbon fluxes. Flux tower data from Turkey Point will validate phenology based models, which can be extended to traffic cameras for broader spatial coverage. Future work will compare greenness-based models with downscaled solar-induced fluorescence (SIF) to deepen insights into urban vegetation's role in carbon cycling.
Manual-labelling Workflow
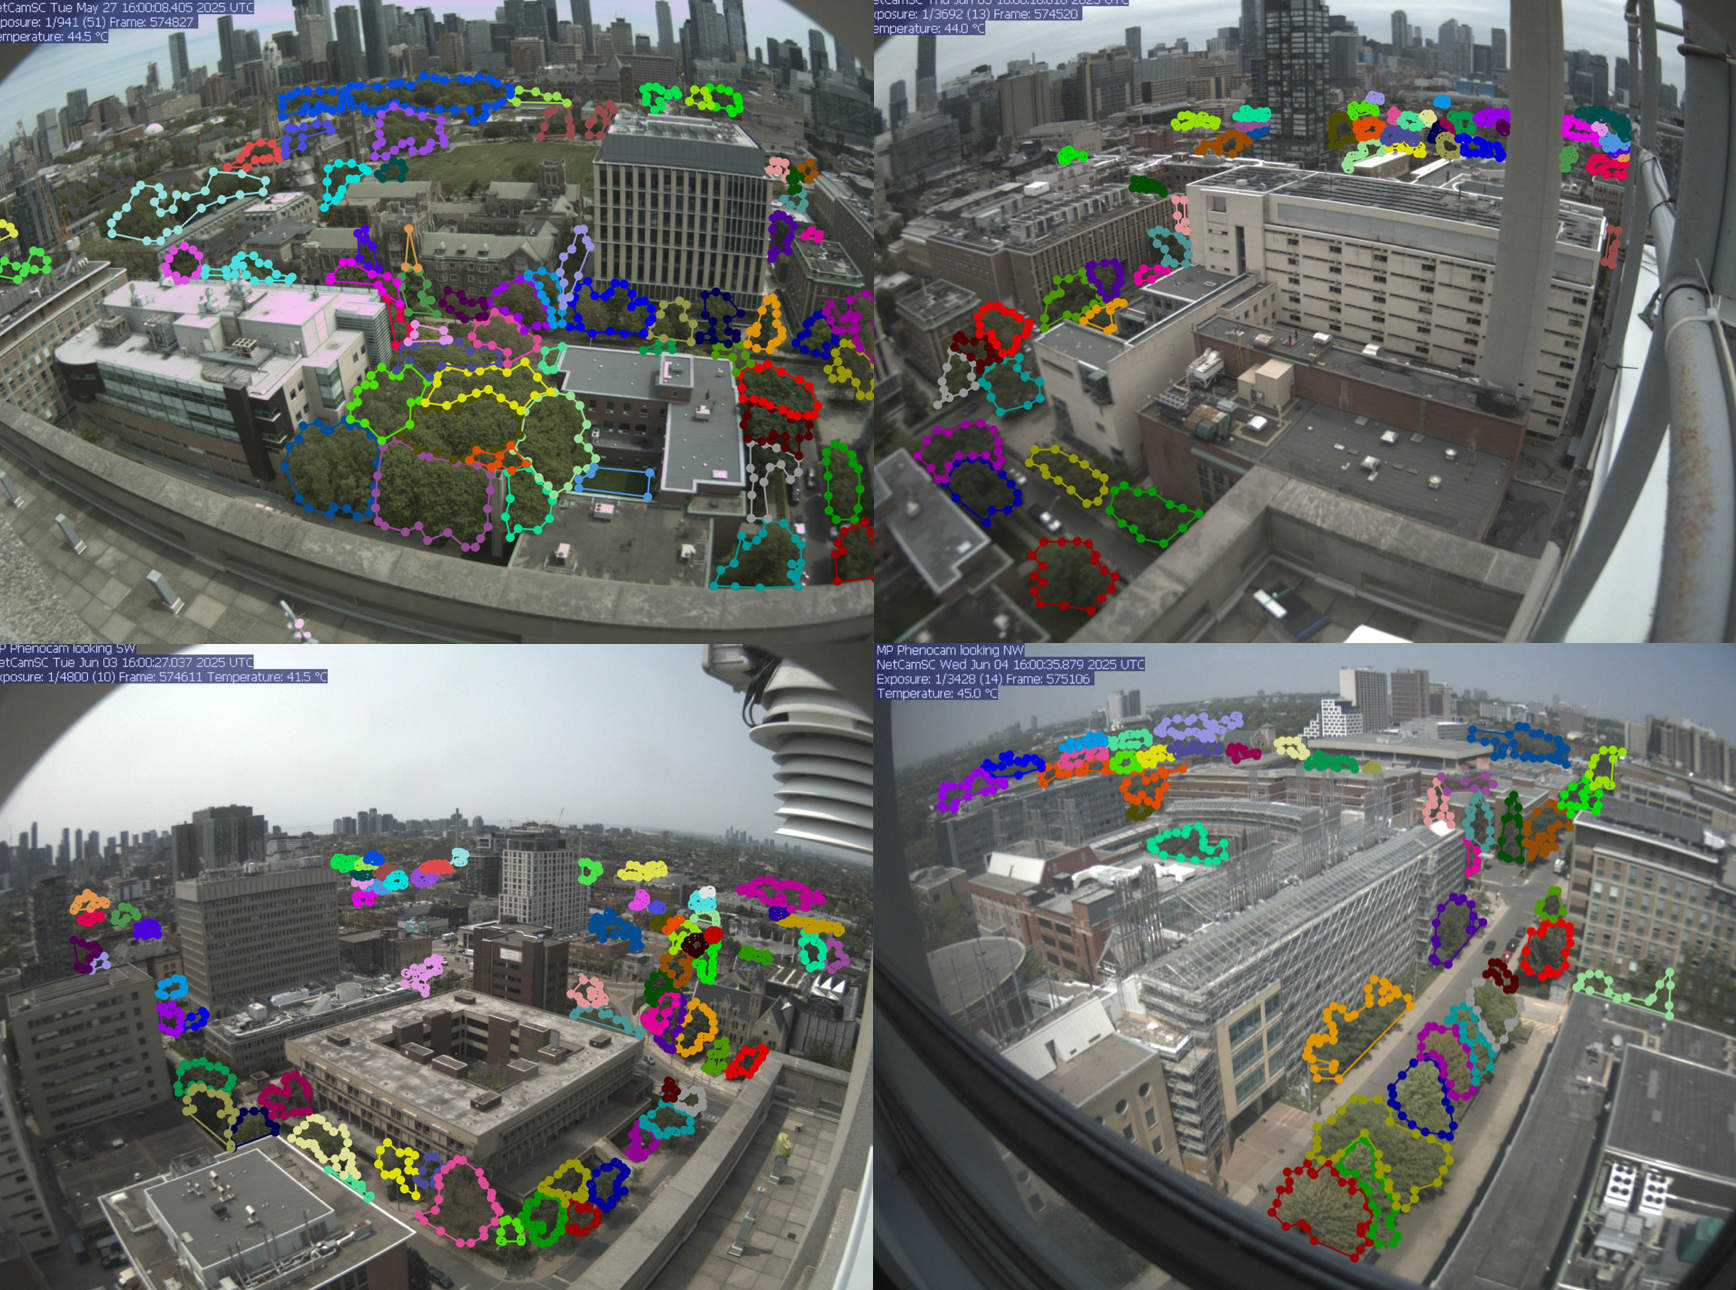
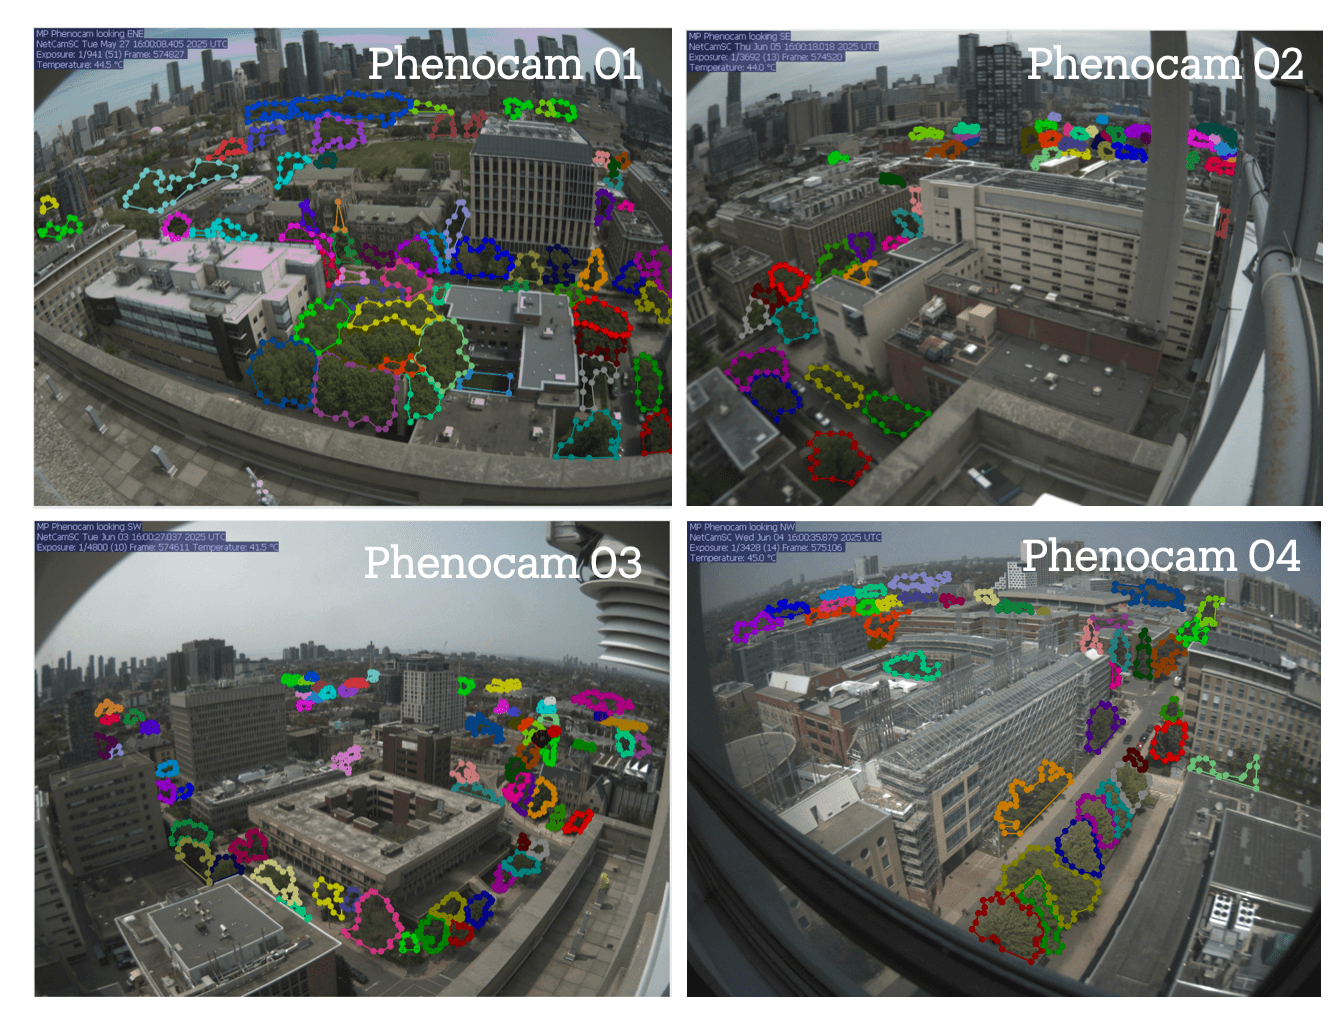
The key challenge in analyzing long time-series images with manually labeled trees (figure 2) is frequent camera movement. To address this, we applied key point extraction with alignment checks to transform each image back to a reference frame with accurately labeled regions.
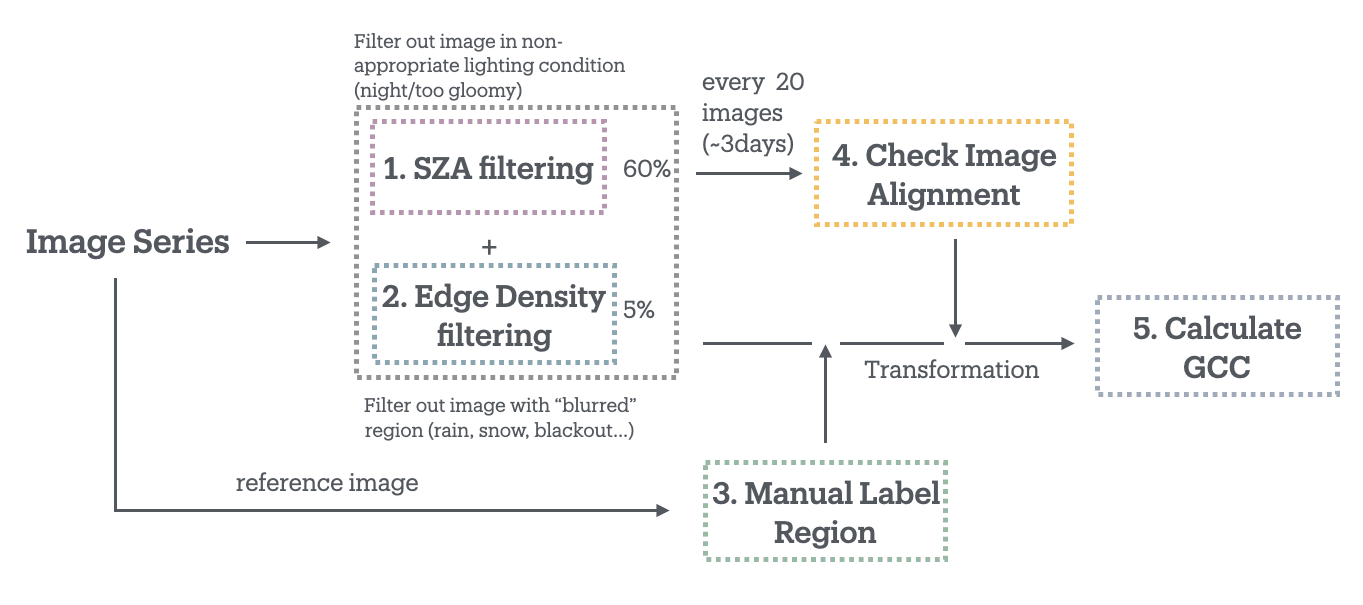
We then introduced soft-boundary ROIs with uncertainty estimation, enabling precise extraction of time-series greenness. For this analysis, greenness was quantified using green chromatic coordinates (GCC), defined as the ratio of RGB values (G/(R+G+B)). The full processing pipeline can be found in figure 3.
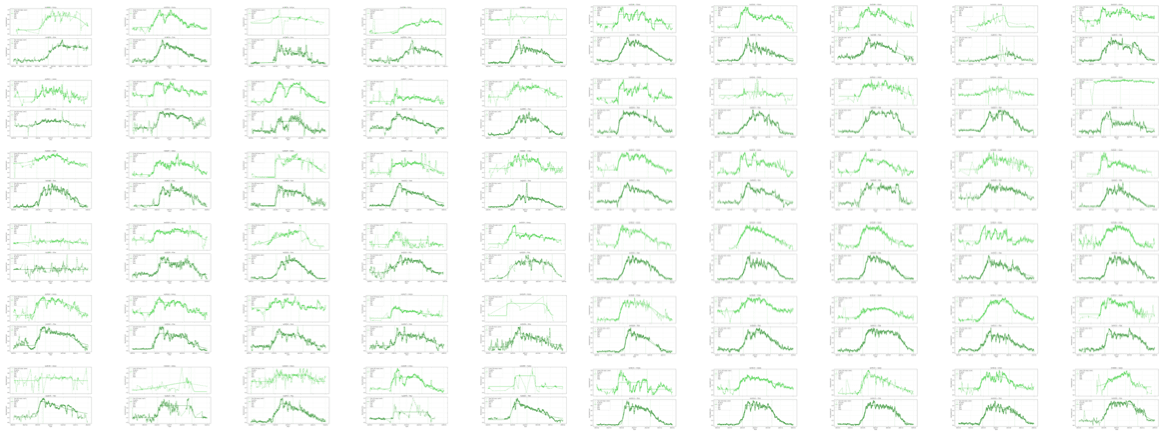
An example of the extracted GCC curve is shown in Figure 4; with appropriate fitting and definition, the growing season is identified as the green bar in Figure 5.
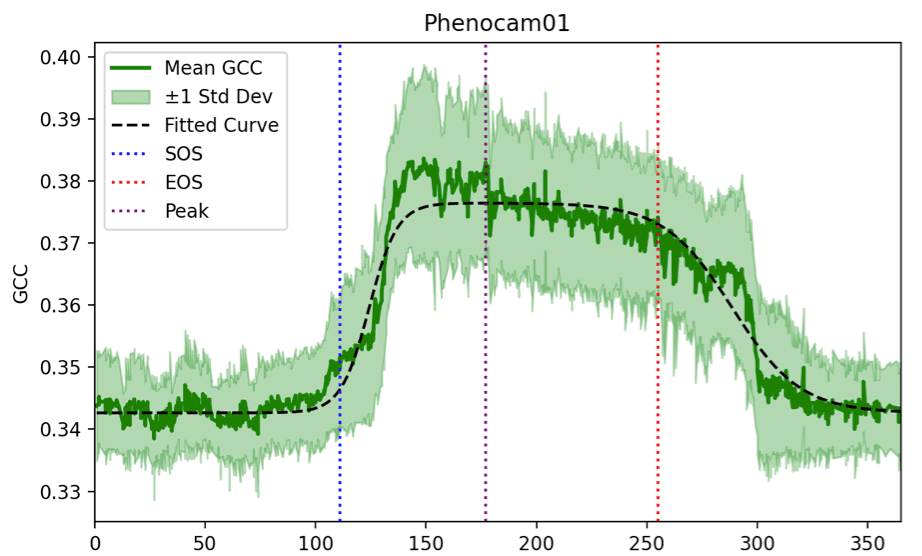
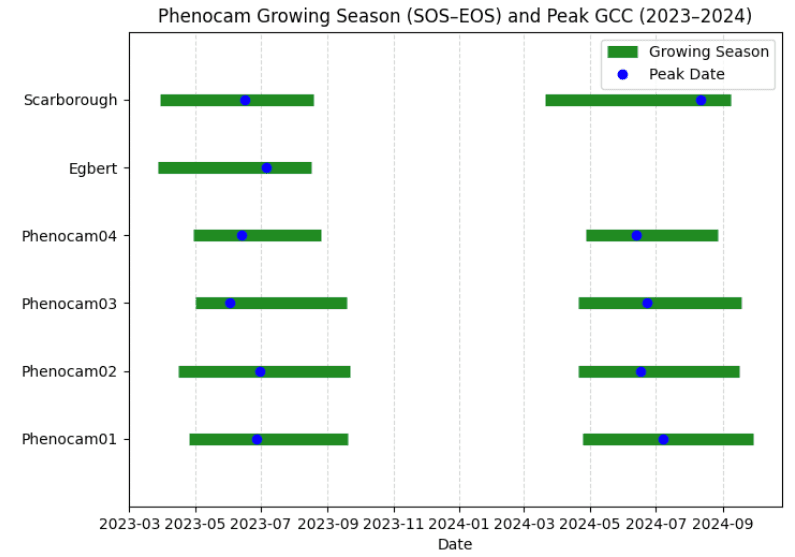
In Figure 5, it can be observed that phenocams 1-4, all located on the downtown campus, generally show a later start and end of season compared to the phenocams in Scarborough and Egbert, which are situated in more rural areas. However, since the spatial resolution of all six cameras is relatively low, traffic cameras are used to provide additional observations.
Auto-labelling Workflow
Similar to the workflow for manual labelling, we applied a comparable methodology to process time series data from traffic cameras. However, because these cameras were originally designed for traffic monitoring, their viewpoints shift significantly over time, making manual labelling impractical. To address this, we employed a pretrained semantic segmentation model to mask regions containing grass and trees, as shown in Figure 6.
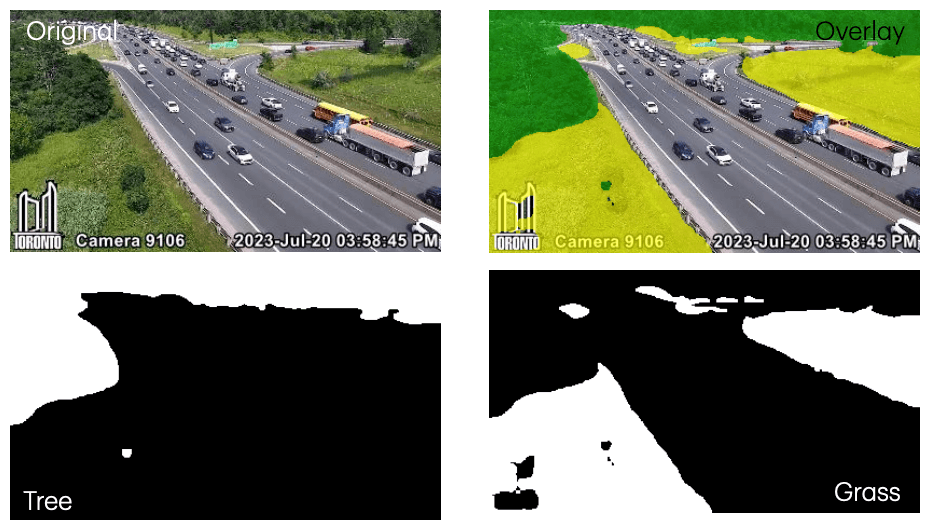
Specifically, we used SegFormer-B0, the most lightweight model of the SegFormer architecture, pretrained on the ADE20K dataset. The full processing pipeline is illustrated in Figure 7.
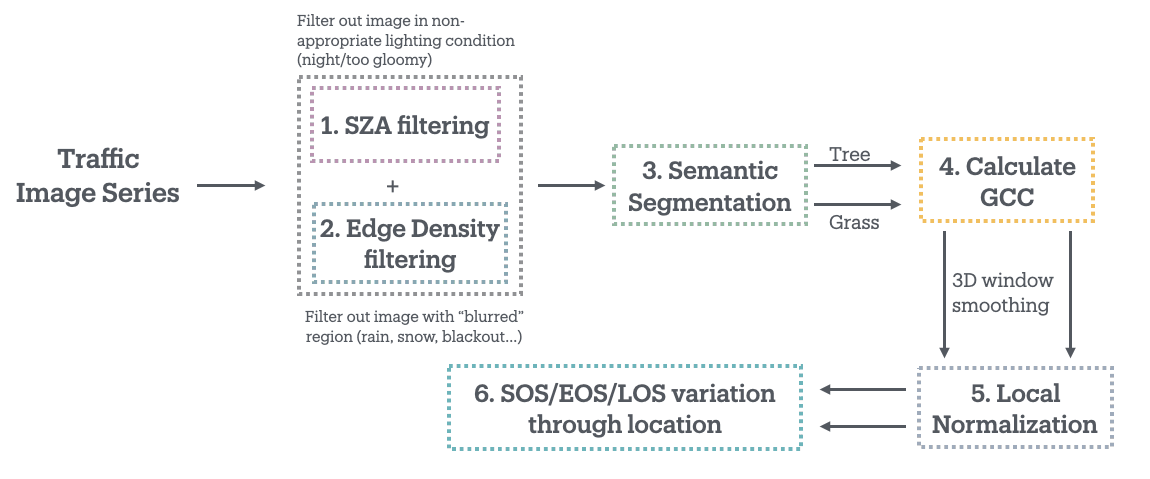
The processed GCC time series are shown in Figure 8; however, due to the properties of traffic cameras, these series are noticeably noisier than those from high-resolution images. A spatial interpolation across the GTA has also been performed, as illustrated in Figure 9. To address the lack of clear patterns, ongoing research is focusing on refining the definitions of SOS (start of season) and EOS (end of season), and incorporating additional color indices in autumn as well as other meteorological data sources.
Validation
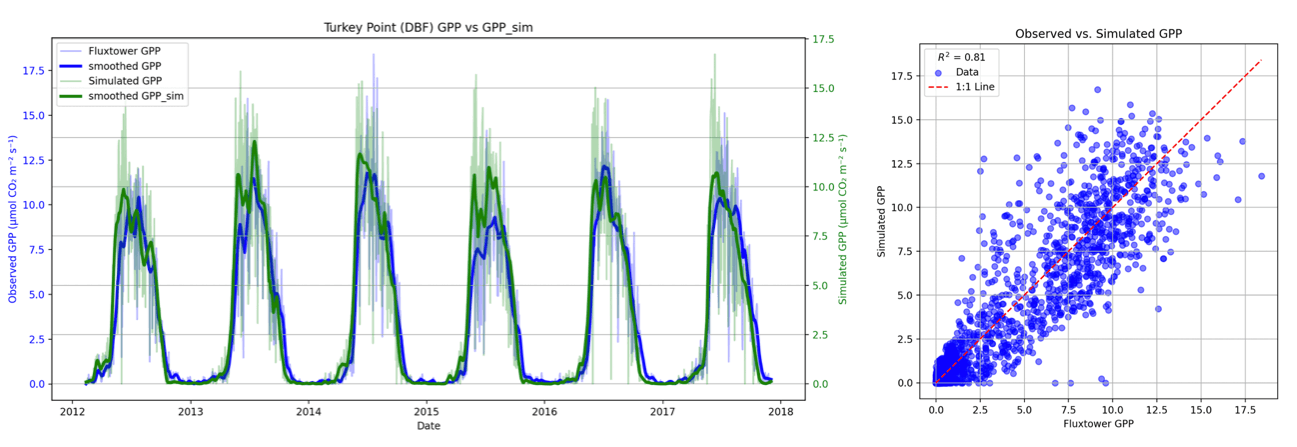
To link phenology with carbon cycles in urban areas, we used Turkey Point in southern Ontario as a validation site and developed a model based on photosynthetically active radiation (PAR) and environmental factors such as vapor pressure deficit (VPD) and temperature (T), with GCC serving as a proxy for fPAR (fraction of PAR). This model was applied to estimate GPP, as shown in Figure 10. To extend the approach to traffic cameras, future work will focus on modeling with relative humidity and temperature as the main drivers and validating results across multiple data sources.
Next Step
Several directions are currently being pursued in this project. One focus is on expanding and validating the traffic-camera GCC network against high-resolution camera observations, with the goal of making the data both interpretable and quantifiable. Another approach involves integrating the GCC network with solar-induced fluorescence (SIF) data to provide deeper insights and enhance confidence in the results. These efforts will be further developed and formalized through the fourth-year thesis.